Design is all around us. It’s so ubiquitous that you don’t even need to search for examples– everywhere you look, there’s a design lesson to be learned. At Flux, we take inspiration from a huge range of sources. From vintage matchbooks to Scandinavian coffee pots, from Renaissance paintings to hi-tech gadgets, we’re always looking to learn and learning to look.
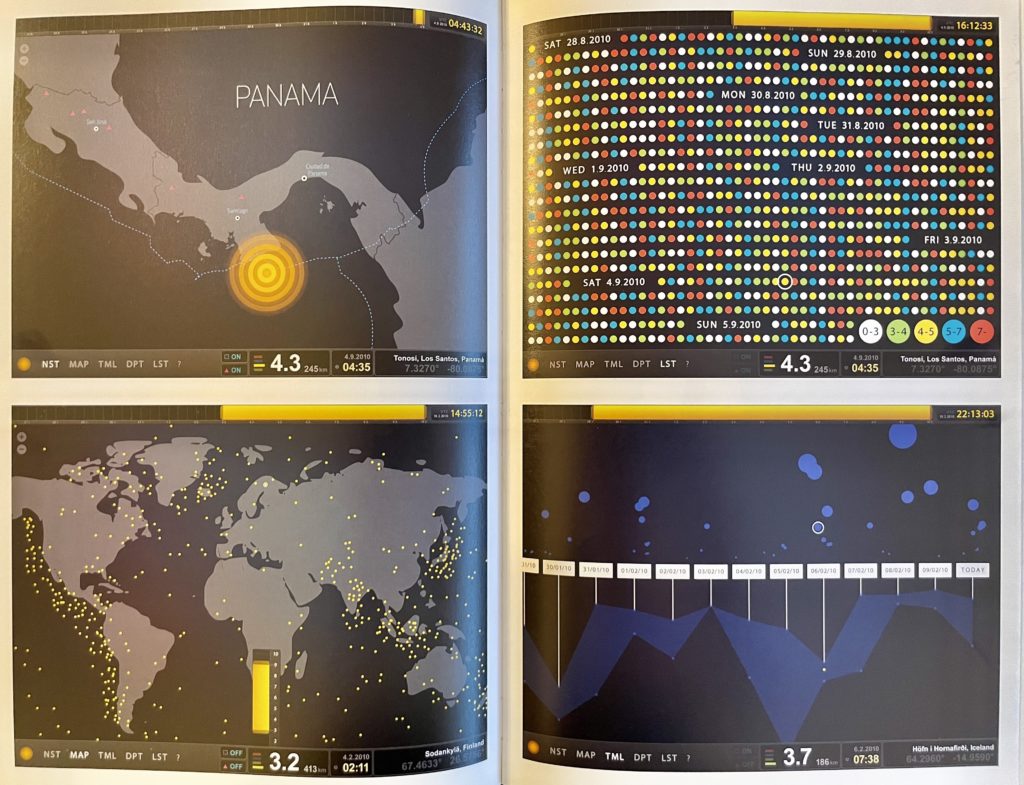
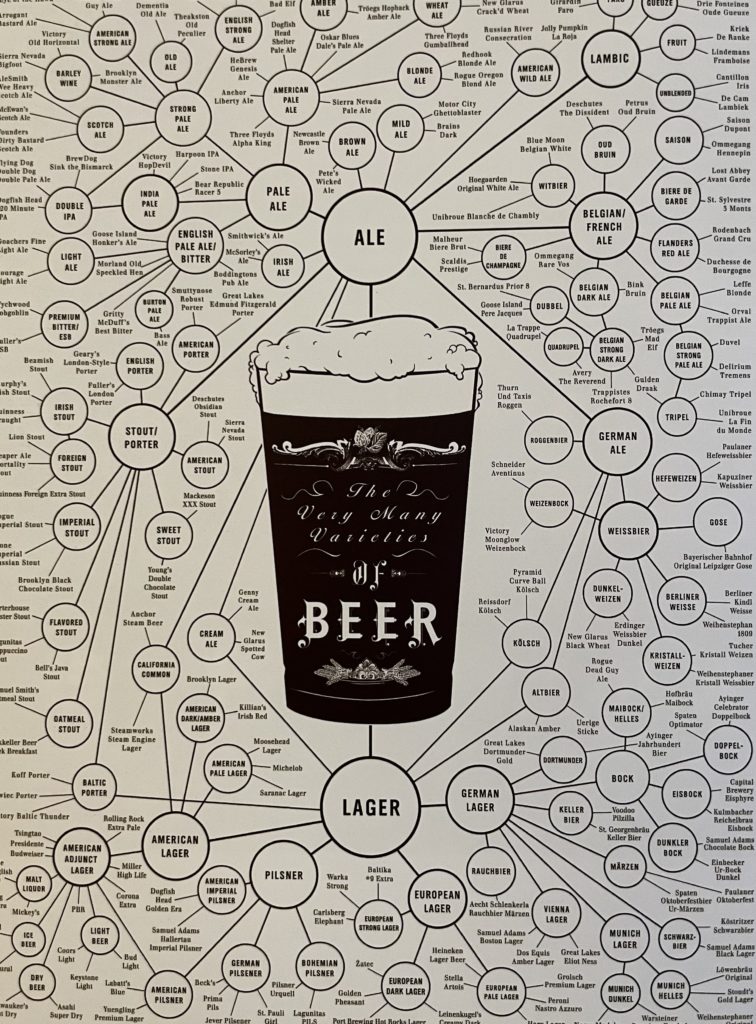
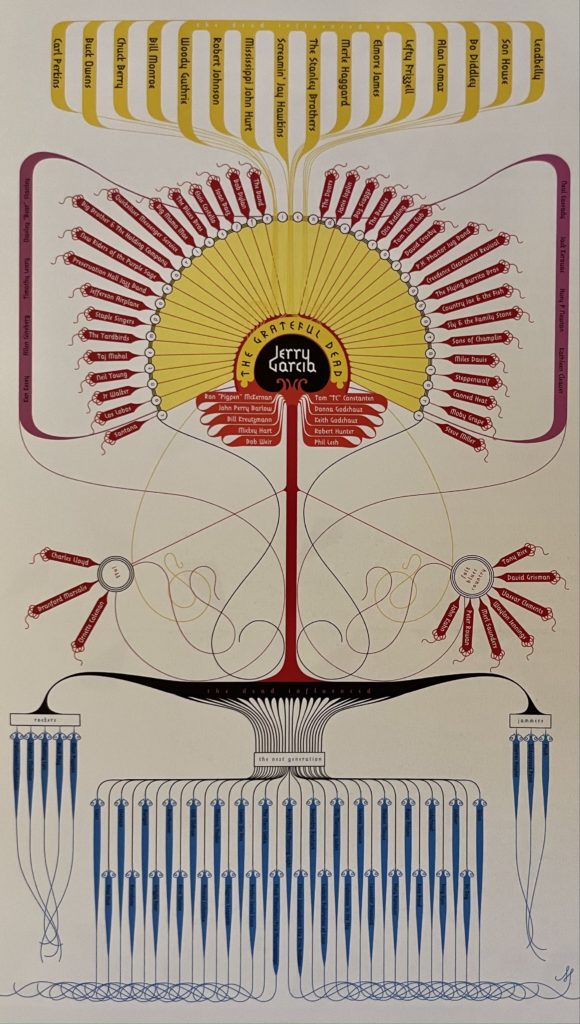
This month, we’re focusing on one thing that makes our design hearts beat: information graphics. Infographics are visual representations of systems, data or knowledge. The term might bring up thoughts of dry powerpoint presentations, but infographics are far from boring. They’re an incredible design challenge. They take something highly complex and often intangible and represent it in an intuitive, immediate way.


Infographics help us navigate and interpret the huge amount of information that bombards us everyday. Whether graphs, maps, diagrams, charts or anything else, they give real meaning to the phrase “visual communication.” We particularly love the book Information Graphics published by Taschen. Here are some spectacular information graphics from that publication. They inspire us to create design that speaks for itself.
https://www.taschen.com/pages/en/catalogue/graphic_design/all/44653/facts.information_graphics.htm